I had to search all over the internet to figure out how to do this in ProxMox. It is much easier in esxi because you can easily create a promiscuous vSwitch and attach the VMs you wish to monitor on that vSwitch. It’s a couple clicks, and you are finished. With ProxMox, it is not quite the same story. There are quite a few things you need to consider in how you approach this. This also is not a one size all fits all solution. I will provide information about my environment that I find to be useful so you can understand why I used the approach I did. I dug through a lot of guides on the internet, none of which really specified what their environment was like (mostly true). There are some that did but weren’t clear on the hardware being used. I am going to include this, so it adds clarity.

Lab Environment

  • Dell r620 Server blade
    • (All VMs run on a single node)
    • 4 Port Network Card (1GB Port Speed)
      • eno1 – Trunk Connection to Cisco switch (Mgmt only)
      • eno2 – Trunk port where all VMs are attached
      • eno3 – Thinking about putting Security Tools on this interface (and not capturing on this)
      • eno4 – Connected to SPAN port on CISCO switch
  • Cisco 3750x 24 Port Switch
    • SPAN port configured

Prerequisite Packages that you need to Install.

apt install openvswitch-switch net-tools ethtool

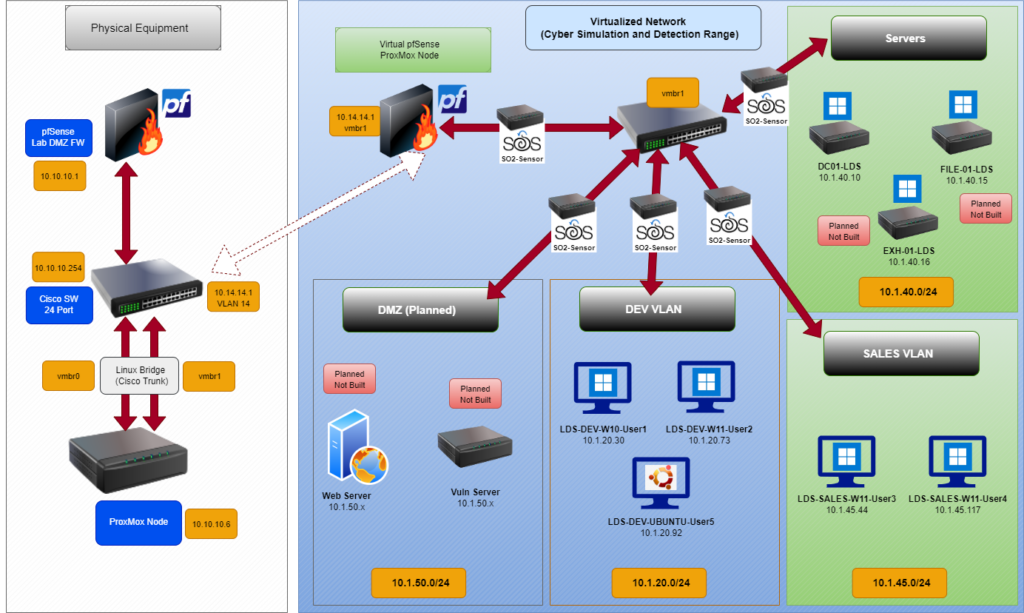
The Diagram below gives you a logical representation of what I am doing. It looks like 5 individual sensors, but it is not. I am running 1 virtual machine (sensor) with 1 promiscuous port. The diagram is a depiction of what it effectively is doing. The different VLANs are attached to the same Linux Bridge, which is essentially acting as a HUB, and I am capturing all the traffic with a SPAN session which is monitoring the physical interface of the bridge my VMs are running on and copying that to my eno4 interface which I configured ProxMox to receive on a dedicated bridge port attached to eno4 where the traffic on my switch is being copied to.

Below is a copy of my /etc/network/interfaces configuration on my ProxMox Node.

# network interface settings; autogenerated
# Please do NOT modify this file directly, unless you know what
# you're doing.
#
# If you want to manage parts of the network configuration manually,
# please utilize the 'source' or 'source-directory' directives to do
# so.
# PVE will preserve these directives, but will NOT read its network
# configuration from sourced files, so do not attempt to move any of
# the PVE managed interfaces into external files!

auto lo
iface lo inet loopback

iface eno1 inet manual

iface eno2 inet manual

iface eno3 inet manual
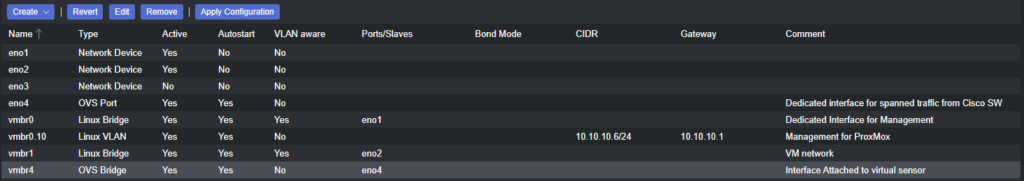
auto vmbr0
iface vmbr0 inet manual
bridge-ports eno1
bridge-stp off
bridge-fd 0
bridge-vlan-aware yes
bridge-vids 2-4094
bridge-pvid 999
#Dedicated Interface for Management

auto vmbr0.10
iface vmbr0.10 inet static
address 10.10.10.6/24
gateway 10.10.10.1
#Management for ProxMox

auto vmbr1
iface vmbr1 inet manual
bridge-ports eno2
bridge-stp off
bridge-fd 0
bridge-vlan-aware yes
bridge-vids 2-4094
bridge_ageing 0
bridge-pvid 999
#VM network

auto eno4
iface eno4 inet manual
ovs_type OVSPort
ovs_bridge vmbr4
#Dedicated interface for spanned traffic from Cisco SW

auto vmbr4
iface vmbr4 inet manual
ovs_type OVSBridge
ovs_ports eno4
#Intefaced Attached to virtual sensor

The above config essentially uses my eno1 interface and creates a vlan aware bridge. On my Cisco switch, I made my native VLAN 999 on the trunk. By default, it is VLAN 1 and you will most likely find help guides that show VLAN 1 instead. I figured I would explain why mine says 999 versus what you would typically see so it made sense. My Management for ProxMox is on VLAN 10, tagged by the cisco switch. I created a sub interface of VLAN 10 and I added a comment to the config as well. I placed comments under each physical and bridged interface for reference. I am not currently utilizing eno3 for anything. This is what I would make my config look like before ever logging into the ProxMox GUI, and then verify what I see once logged into the GUI which I will show below. All the previous steps I am mentioning would be done from the command line. Once everything looks good, I save the configuration, then reboot the server as I have found just restarting the networking service has been hit and miss. Once the server is booted back up, just log into your server with the URL and port 8006. This is what the networking section will look like.

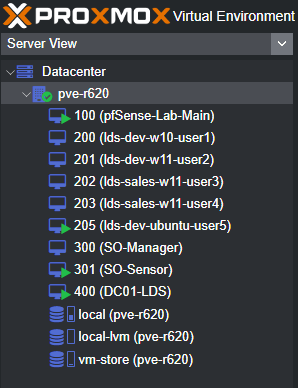
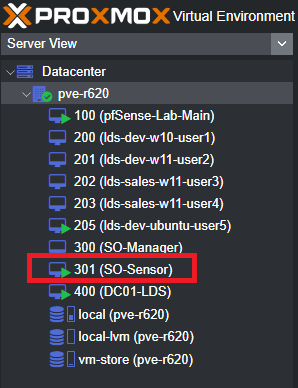
Below is my VM List in Prox List. You will notice it is only one node as I have mentioned before, and the VMs that I had running in my test. I have a bunch of networks hosted behind a pfSense firewall. My VMs and firewall are all on the same bridge, which is vmbr1. This guide is not meant how to configure pfSense and setup logical networks, I want to stay in the scope of the SPAN / Port Mirroring configuration.

ProxMox Node With Running VMs below
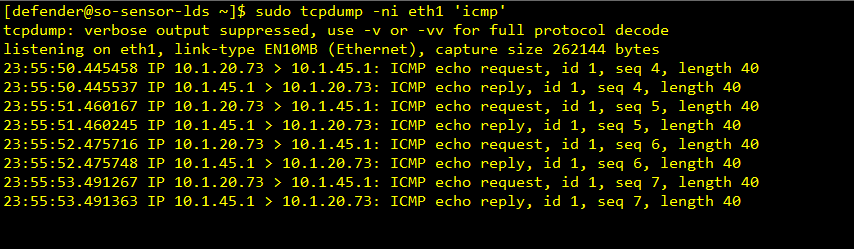
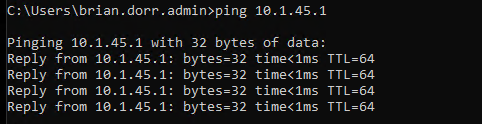
When you run a ifconfig, or ip link form the command line of your ProxMox server, you will see tap ports associated to the VM ID numbers generated by ProxMox. I chose to number mine a specific way (preference). 

Anyways, you will notice that if a VM has multiple interfaces, you will see multiple tap interfaces followed by an i and a number (starts with 0) and works its way up. The first interface on my Security Onion sensor is Management. My second interface is the promiscuous interface. This is important for when you run the command to copy all traffic to this interface. I will post a link to the sites I used and where I got this script from. You just have to modify it to fit your environment.

As you can see in the pictures, that tap interface correlates to the VM ID number, so it should make sense now that you can see it

The Script to setup the Mirror

This script will run two commands and send the output to a log file that you specify. It clears any mirrors on the vmbr you want to send the data to and then it collects all traffic and sends it to the specified vmbr of your choosing. Here is a link to the script that you can modify. I will post a screenhsot of how I manipulated it for my environment.

#!/bin/bash

# seconiontap.sh

SECONIONLOG=/root/logs/seconiontap.log

date >> $SECONIONLOG

echo "####################" >> $SECONIONLOG

echo "Clearing any existing mirror..." >> $SECONIONLOG

ovs-vsctl clear bridge vmbr4 mirrors

echo "Creating mirror on vmbr4 for Security Onion..." >> $SECONIONLOG

ovs-vsctl -- --id=@p get port tap301i1 \
-- --id=@m create mirror name=seconionspan select-all=true output-port=@p \
-- set bridge vmbr4 mirrors=@m >> $SECONIONLOG

echo "Showing existing mirrors..." >> $SECONIONLOG

ovs-vsctl list Mirror >> $SECONIONLOG

echo "####################" >> $SECONIONLOG

Remeber…This script is specific to me.

Once you run the script, you can cat the log output or tail it if you have done it several times. It continues to append to bottom each time you run the script. This is not persistent on reboots, so there is a crontab entry you need to add so after each reboot, it will set the mirror back up. I suggest verifying with tcpdump after a reboot to verify everything is working, even if the script ran successfully. It only takes a few seconds. Review the script so you understand what it is doing.

Testing that I am capturing traffic

After I have completed all steps above, to include creating the SPAN port on your switch that ProxMox is connected to, feeding it back into itself on a dedicated port, you should be able to run a tcpdump and jus filter for icmp. I do this because I can control when and how long I decide to run the test. I ran a ping from a windows 11 host to my domain controller. Below is a screenshot of a successful capture of my icmp packets. You see both the request and the reply.

Ping Test

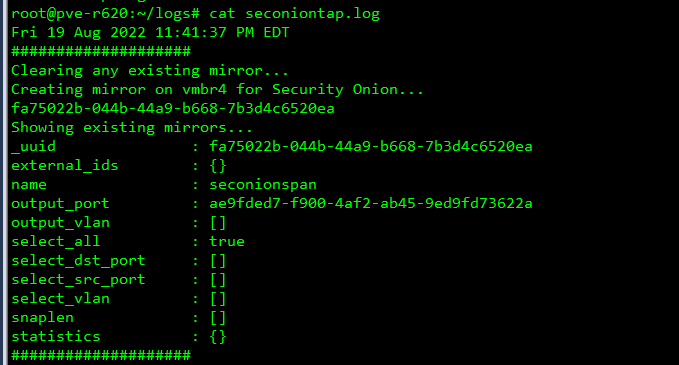
Capture on Security Onion Sensor

That’s it. I hope this is helpful because I know I spent days trying to figure this out and a lot of different websites and phone calls with co-workers and friends. There are still kinks I am working out. I will update this post if I can tweak it. Please feel free to leave comments below.

Leave a comment

Your email address will not be published. Required fields are marked *